Home prices in the USA have increased from $25,800 in 1971 to $419,200 in 2024. Over this same period of time household income has also increased but at a much slower rate. For this reason when looking at historical home affordability a common ratio is the home price to income ratio. This ratio allows us to see trends in home affordability.
Table of Contents
What is the home price to income ratio?
The home price to income ratio is a simple measure of affordability that divides the median home price by the median household income. A higher ratio means homes are less affordable relative to incomes. In 1971 the ratio was 1.41 meaning the median home cost just over one year of household income. By 2024 this ratio has risen to 5.04 meaning it now takes more than five times the median household income to purchase the median priced home.
One crucial aspect that the home price to income ratio overlooks is the impact that mortgage rates play on the affordability of a home. For this we can take the cost of a mortgage payment throughout the years and compare it to the household income at the time. Comparing mortgage payment allows us to consider the impact of both increasing home price and mortgage rates in comparison to household income.
Historical mortgage payment as a percentage of income
This graph shows a breakdown of the percentage of household income your mortgage payment takes up.
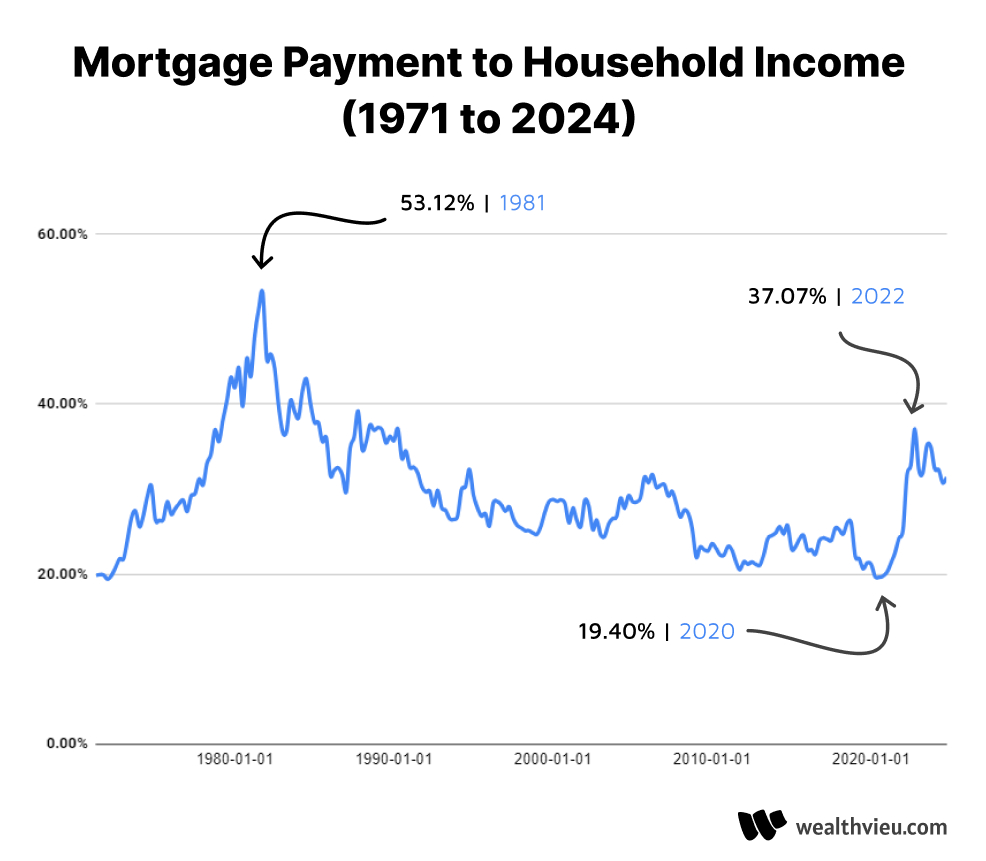
The percentage of household income spent on mortgage payments has had many changes over the years. The most notable periods were in 1981 when it would take 53.12% of household income to cover the mortgage payment. Although the home price at the time was only 3.67 times household income, the 30-year fixed mortgage rate was 17.7% which made affording mortgage payments difficult.
What is the home cost to income ratio in 2024?
As of 2024 the home price to income ratio is 5.04 with a median home price of $419,200 and household income of $83,100. The average 30-year fixed mortgage rate during this period was 6.60% which translates to a mortgage payment of $2,175 considering a 10% down payment which equates to 31.41% of the median household income.
Why is the home price to income ratio increasing?
Several factors have contributed to the increasing home price to income ratio over the decades. Limited housing supply, population growth, and low interest rates from 2009 to 2021 drove home prices up while wage growth remained relatively stagnant. The mortgage affordability gap has widened as a result making it increasingly difficult for the median household to purchase a home without spending more than the recommended 30% of income on housing costs.
To find out how much home you can afford, try using our mortgage affordability calculator. You can also calculate the income needed to afford a home in each state.