This calculator helps you find your income percentile in the USA based on income.
The median income in the USA for 2024 is $50,200 which is the 50th percentile. When it comes to the average individual income it is $73,472 which is much higher than the mean.
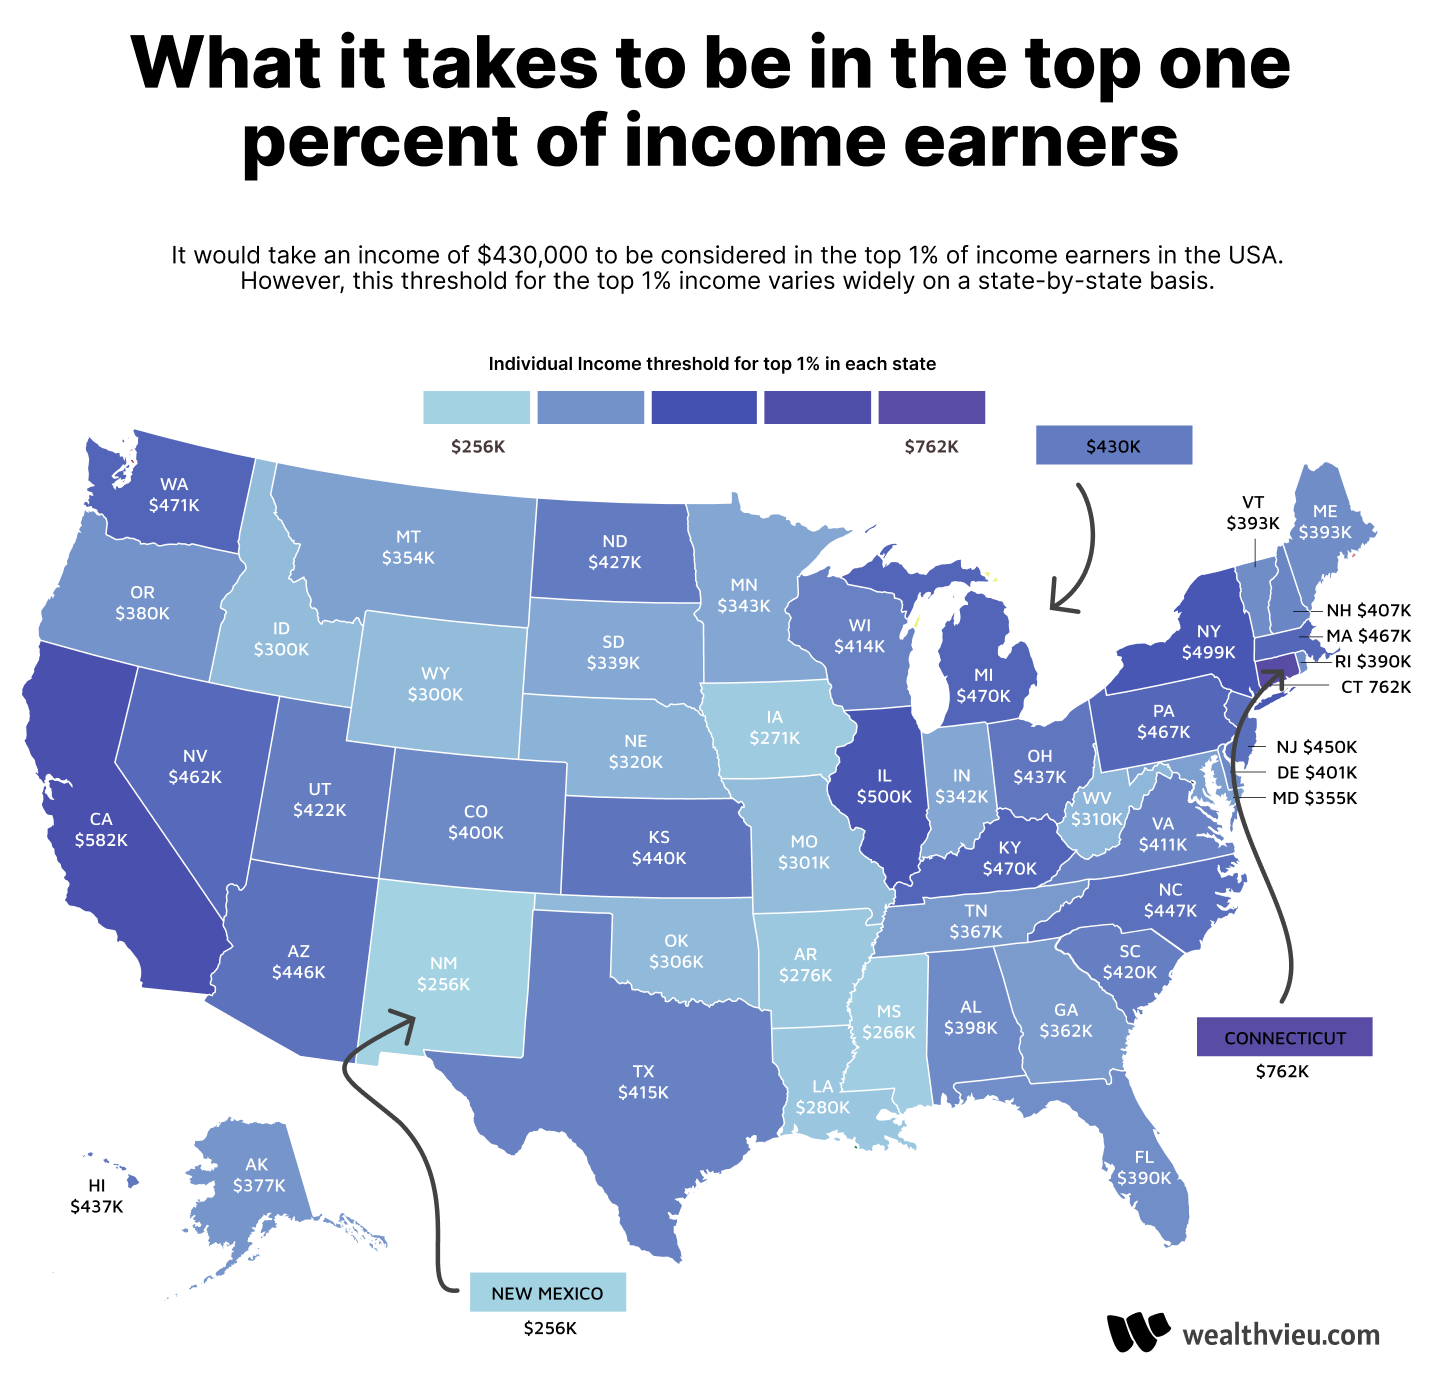
How much would it take to be in the top 1% of income in US? You would need income of $430,000 to join the top 1% in US.
Table of Contents
What does it take to join the top 1% of income earners in the USA?
To reach the 99th percentile or top 1% of income earners in the USA it would take an income of $430,000 to put you in the top 1% of individual income earners. The increase required is even higher if you want to reach the top 1% of household income which would take income of $631,500.
Top 1% household and individual income by state
What does it take to reach the top 1% of income earners on a state-by-state basis?
The state with the highest threshold to join the top 1% is Connecticut. It would take individual income of $761,957 or household income of $1,135,999 to join the top 1%. This table breaks down what it would take in income to join the top 1% of income on a state-by-state basis.
Want to know what percentile you fall into? Enter your income in the calculator above to find out.
Feel free to use this visualization in your work. Please give credit by linking back to https://wealthvieu.com/income-percentile-calculator/
Interested in what it takes to be in the top 1% of wealth in the United States? Check out our net worth percentile calculator.
The below chart also shows that it would take to be considered in the top 1% of income earners based on household income in addition to individual income.
| State | Top 1% Household Income | Top 1% Individual Income |
|---|---|---|
| Alabama | $521,494 | $398,099 |
| Alaska | $639,115 | $376,965 |
| Arizona | $550,198 | $446,005 |
| Arkansas | $380,300 | $275,999 |
| California | $849,049 | $582,350 |
| Colorado | $528,000 | $400,150 |
| Connecticut | $1,135,999 | $761,957 |
| Delaware | $660,499 | $400,601 |
| District of Columbia | $1,033,000 | $644,410 |
| Florida | $555,002 | $389,851 |
| Georgia | $586,543 | $362,100 |
| Hawaii | $636,453 | $436,646 |
| Idaho | $485,101 | $300,401 |
| Illinois | $694,800 | $500,160 |
| Indiana | $467,510 | $341,999 |
| Iowa | $380,536 | $271,139 |
| Kansas | $852,821 | $440,300 |
| Kentucky | $773,254 | $470,005 |
| Louisiana | $399,548 | $280,038 |
| Maine | $473,999 | $392,972 |
| Maryland | $624,410 | $355,010 |
| Massachusetts | $714,795 | $467,300 |
| Michigan | $603,610 | $469,550 |
| Minnesota | $455,600 | $343,015 |
| Mississippi | $353,876 | $265,817 |
| Missouri | $465,655 | $301,100 |
| Montana | $497,502 | $354,427 |
| Nebraska | $697,302 | $320,101 |
| Nevada | $596,578 | $462,030 |
| New Hampshire | $618,613 | $407,483 |
| New Jersey | $704,678 | $450,000 |
| New Mexico | $392,031 | $256,007 |
| New York | $751,103 | $498,800 |
| North Carolina | $633,412 | $446,500 |
| North Dakota | $527,100 | $427,000 |
| Ohio | $583,259 | $437,400 |
| Oklahoma | $481,154 | $305,504 |
| Oregon | $521,203 | $380,000 |
| Pennsylvania | $603,851 | $467,491 |
| Rhode Island | $517,500 | $389,605 |
| South Carolina | $676,882 | $420,002 |
| South Dakota | $559,164 | $338,764 |
| Tennessee | $485,752 | $367,465 |
| Texas | $660,014 | $415,388 |
| Utah | $544,923 | $421,501 |
| Vermont | $587,900 | $392,500 |
| Virginia | $736,701 | $410,618 |
| Washington | $720,636 | $470,729 |
| West Virginia | $467,823 | $310,000 |
| Wisconsin | $580,850 | $413,501 |
| Wyoming | $403,024 | $300,000 |
Top 1% income percentile in the United States by age
An individual income of $430,000 is needed in 2024 to be considered in the 99th percentile or top 1% of all individual income earners in the USA.
The top 1% income is heavily influenced by age. For those who are 16 years old it takes $85,000 a year to join the top 1% of income earners. If you are 46 years old it would take income of $920,000 to be considered in the top 1% of income earners.
Since there are less observations for those earning a top 1% salary, the total income for top 1% earners as you move between age categories can vary substantially with a few individuals skewing the income.
To provide a better understanding of the threshold for the top 1% at a specific age, take into consideration the threshold in the ages above and below as well as the trend in the median income.
If you want to know your income percentile by age, use the income percentile by age calculator.
| Age | Top 1% Income by Age | Median Income by Age |
|---|---|---|
| 16 | $85,000 | $8,000 |
| 17 | $85,000 | $8,500 |
| 18 | $88,000 | $13,000 |
| 19 | $108,000 | $20,000 |
| 20 | $86,406 | $25,000 |
| 21 | $100,000 | $26,400 |
| 22 | $115,000 | $30,000 |
| 23 | $119,225 | $33,000 |
| 24 | $179,998 | $37,000 |
| 25 | $200,000 | $45,000 |
| 26 | $190,000 | $46,800 |
| 27 | $200,000 | $47,000 |
| 28 | $300,000 | $50,000 |
| 29 | $270,000 | $55,000 |
| 30 | $300,000 | $55,000 |
| 31 | $300,000 | $55,000 |
| 32 | $300,000 | $58,000 |
| 33 | $278,002 | $60,000 |
| 34 | $400,000 | $60,000 |
| 35 | $400,000 | $61,500 |
| 36 | $380,000 | $60,000 |
| 37 | $380,000 | $60,000 |
| 38 | $430,000 | $60,000 |
| 39 | $500,000 | $62,500 |
| 40 | $410,000 | $60,000 |
| 41 | $410,000 | $60,000 |
| 42 | $400,000 | $62,400 |
| 43 | $400,000 | $65,000 |
| 44 | $400,000 | $61,250 |
| 45 | $400,000 | $60,000 |
| 46 | $920,000 | $65,000 |
| 47 | $500,000 | $60,000 |
| 48 | $440,000 | $65,000 |
| 49 | $500,000 | $65,000 |
| 50 | $420,000 | $70,000 |
| 51 | $450,000 | $65,000 |
| 52 | $450,000 | $65,000 |
| 53 | $430,000 | $64,000 |
| 54 | $430,000 | $65,000 |
| 55 | $350,000 | $65,000 |
| 56 | $300,000 | $60,000 |
| 57 | $530,000 | $65,000 |
| 58 | $500,000 | $60,000 |
| 59 | $370,000 | $60,000 |
| 60 | $350,000 | $60,000 |
| 61 | $500,000 | $60,000 |
| 62 | $400,000 | $65,000 |
| 63 | $350,000 | $58,000 |
| 64 | $550,000 | $60,000 |
| 65 | $450,000 | $55,000 |
| 66 | $400,000 | $55,735 |
| 67 | $360,000 | $50,000 |
| 68 | $750,000 | $50,000 |
| 69 | $600,000 | $43,664 |
| 70 | $550,000 | $44,000 |
Top 2% income percentile in USA
To be in the top 2% of individual income earners in the US, you need to earn at least $280,000 per year in 2024. The top 2% threshold varies significantly by state. In high-cost states like Connecticut and California, the top 2% household income can exceed $500,000, while in states like Mississippi and Arkansas it may be closer to $250,000.
The gap between the top 1% ($430,000) and top 2% ($280,000) is $150,000, which illustrates how rapidly income concentrates at the very top of the distribution.
Top 5 percent income in USA
To be considered in the top 5% of income earners or 95th percentile, the threshold is $201,050 in 2024. This means that approximately 8.3 million Americans earn above this level. The top 5% is often considered the entry point to “high income” status and is a common benchmark used by financial planners and economists.
To put this in perspective, the gap between the median income ($50,200) and the top 5% threshold ($201,050) is roughly 4x. However, the gap between the top 5% and top 1% ($430,000) is more than 2x, showing how income accelerates at higher percentiles.
Top 10 percent income in the USA
To reach a top 10% individual income or the 90th percentile of individual income earners in the USA you would need to earn $150,000 in 2024.
2024 income percentile source: Sarah Flood, Miriam King, Renae Rodgers, Steven Ruggles, J. Robert Warren, Daniel Backman, Annie Chen, Grace Cooper, Stephanie Richards, Megan Schouweiler, and Michael Westberry. IPUMS CPS: Version 11.0 [dataset]. Minneapolis, MN: IPUMS, 2023. https://doi.org/10.18128/D030.V11.0