Use this income percentile calculator to see where your salary ranks in the U.S. Enter your annual income, age, and household details to estimate your percentile and compare your result against national benchmarks.
💡 Now that you know your income percentile — what's next?
The median income in the USA for 2024 is $50,200, which is the 50th percentile. The average individual income is $73,472 — significantly higher than the median because high earners pull the average up. This gap between mean and median is one of the clearest indicators of income inequality in the United States.
How much would it take to be in the top 1% of income in the US? You would need income of $430,000 to join the top 1%.
🎯 What Your Income Percentile Actually Means
Your income percentile isn’t just a number—it tells a story about where you stand and what’s possible. Here’s how to interpret your result:
If You’re in the 1st-25th Percentile
You’re likely early in your career, working part-time, or in a transitional period. Many workers in this range earn close to or at the federal minimum wage. The good news? This bracket has the highest potential for percentage growth. Moving from $20,000 to $40,000 doubles your income and jumps you 20+ percentiles.
Quick wins at this stage:
- Certifications in high-demand fields (average salary bump: 15-20%)
- Negotiating your first raise (most people never ask)
- Side income from skills you already have
- Consider trade careers: electricians, plumbers, and HVAC techs earn well above median without a four-year degree
If You’re in the 25th-50th Percentile
You’re earning around the American median. You have company — roughly 82 million Americans are in this range, including many early-career teachers and administrative workers. At this level, strategic career moves matter more than grinding hours.
What separates this bracket from the next:
- Industry choice (same role pays 40% more in tech vs retail — see income by occupation)
- Geographic arbitrage (remote work + lower cost of living)
- Specialization vs generalization
- Education level — a bachelor’s degree holders earn 65% more on average
If You’re in the 50th-75th Percentile
You’re officially above average. Only 1 in 2 Americans earns more than you. This is often called the “comfortable middle” — bills are paid, but wealth building requires intentionality. If you’re wondering is $75k a good salary, the answer is yes — you’re solidly in this bracket.
The trap at this level: Lifestyle inflation. Every raise gets absorbed by a nicer car, bigger apartment, or more dining out. The gap between 50th and 75th percentile is often saved, not earned. Creating a monthly budget and tracking your savings rate is crucial here.
If You’re in the 75th-90th Percentile
You’re in the top quarter of earners. This bracket includes senior professionals, managers, and skilled tradespeople. Is $100k a good salary? At the 82nd percentile nationally, it’s better than “good” — you out-earn more than 4 in 5 Americans. You likely have options — the question is whether you’re optimizing them.
Common paths from here:
- Management track (people leadership)
- Expert track (deep specialization)
- Entrepreneurship (leverage + risk)
- Geographic advantage — your salary goes further in lower-cost cities (compare cities)
If You’re in the 90th-99th Percentile
You’re in elite territory — only 1 in 10 Americans earns what you do. At this level, tax optimization often matters more than earning more. Understanding your federal tax brackets and maximizing tax-advantaged accounts can save you tens of thousands annually. A good CPA can be worth their fee many times over.
What to watch:
- Are you maxing out 401(k) contributions and IRA limits?
- Is your income diversified (W-2 + investments + side business)?
- Estate planning and beneficiary designations become important
- If self-employed, are you optimizing self-employment tax?
If You’re in the Top 1%
You’ve reached a level most never will. Your income likely comes from multiple sources: high-level employment, business ownership, or investments. For a deep dive into this bracket, see our top 1% income analysis and top 1% net worth breakdown.
At this level, focus shifts to:
- Wealth preservation over accumulation — your net worth should be growing faster than your spending
- Tax strategy (trusts, charitable giving, how bonuses are taxed)
- Legacy and impact
- Ensuring your 401(k) and taxable accounts are properly allocated
📈 How to Move Up: Strategies by Current Bracket
Income growth isn’t random—it follows patterns. Here’s what actually works at each level:
Moving from Bottom 25% → Middle 50%
Fastest paths (6-18 months):
- Trade certifications: Electricians, plumbers, and HVAC techs average $60k+ with 6-month programs
- Tech bootcamps: Web development, data analytics, cybersecurity (average starting salary: $65k)
- Sales roles: No degree required, uncapped commission potential
- CDL license: Truck drivers average $50-80k, 3-week training
Moving from Middle 50% → Top 25%
This jump requires leverage:
- Job hopping strategically: Average raise for staying = 3%. Average raise for switching = 15% (real wage growth data)
- Remote work arbitrage: Earn SF salary, live in Austin (effective 40% raise — compare cities)
- Add high-value skills: SQL, Excel mastery, project management (PMP)
- Negotiate properly: Research shows 70% of employers expect negotiation but only 39% of workers do it
Moving from Top 25% → Top 10%
Management or mastery:
- People leadership: Managing teams typically adds $30-50k
- Revenue responsibility: Roles tied to company revenue pay premiums
- Industry switch: Same skills in finance, tech, or pharma pay 30-50% more (see income by industry)
- Advanced credentials: MBA, specialized certifications (education premium data)
Moving from Top 10% → Top 1%
This requires ownership or scarcity:
- Equity compensation: Stock options, RSUs, profit sharing
- Business ownership: Even small businesses can generate $300k+ for owners
- Extreme specialization: Top surgeons, trial lawyers, investment bankers
- Sales at scale: Enterprise sales, real estate development, M&A advisory
👥 Who’s In Your Income Bracket? Career Comparison
Curious what careers typically land in each percentile? Here’s a realistic breakdown:
| Percentile | Typical Careers |
|---|---|
| 10th-25th | Retail workers, food service, entry-level admin, part-time workers |
| 25th-50th | Teachers (early career), customer service, skilled laborers, junior office workers |
| 50th-75th | Mid-career teachers, nurses, accountants, police officers, electricians |
| 75th-90th | Senior engineers, managers, pharmacists, senior nurses, small business owners |
| 90th-95th | Directors, dentists, lawyers, senior software engineers, successful realtors |
| 95th-99th | C-suite executives, surgeons, partners at firms, tech leads at FAANG |
| Top 1% | Business owners, executives, specialized physicians, top finance roles |
Key insight: The same job title can span 3-4 percentile brackets depending on industry, location, and experience. A “software engineer” might earn $70k (60th percentile) or $400k (99th percentile). See our income by occupation breakdown for detailed salary data across hundreds of careers.
For a broader look at how salaries vary geographically, check our average salary by state data. The same percentile can mean very different lifestyles depending on where you live.
Sources
- U.S. Census Bureau. “Income and Poverty in the United States.” census.gov/topics/income-poverty
- U.S. Department of Labor. “Wages and the Fair Labor Standards Act.” dol.gov/agencies/whd/flsa
- Social Security Administration. “Benefits and Eligibility Information.” ssa.gov/benefits
🏠 What Your Percentile Buys in Different Cities
Income percentile is relative — $100,000 in Manhattan feels very different from $100,000 in Memphis. Here’s how purchasing power shifts across major cities (use our cost of living calculator for a personalized comparison):
| Income | NYC Equivalent | SF Equivalent | Austin Equivalent | Memphis Equivalent |
|---|---|---|---|---|
| $50,000 | $50,000 | $47,000 | $58,000 | $71,000 |
| $75,000 | $75,000 | $70,500 | $87,000 | $107,000 |
| $100,000 | $100,000 | $94,000 | $116,000 | $142,000 |
| $150,000 | $150,000 | $141,000 | $174,000 | $213,000 |
Translation: A 50th percentile income ($50,200) in Memphis has the purchasing power of a 75th percentile income in San Francisco.
This is why geographic arbitrage — working remotely for a high-cost-of-living employer while living in a low-cost area — has become one of the fastest wealth-building strategies. If your employer pays San Francisco rates but you live somewhere with average monthly expenses of $3,500 instead of $5,500, you’re effectively pocketing an extra $24,000 a year. That’s money that goes straight to your net worth.
📊 Track Your Progress: Set an Income Goal
Your income percentile isn’t fixed. Most Americans see their peak earning years between ages 45-55. Tracking your percentile annually is a powerful way to measure career progress — it adjusts for inflation automatically, unlike raw salary numbers.
Challenge yourself: Where do you want to be in 5 years?
| Current Percentile | Realistic 5-Year Target | Required Annual Growth |
|---|---|---|
| 25th ($28,000) | 50th ($50,200) | 12.4% per year |
| 50th ($50,200) | 75th ($88,710) | 12.1% per year |
| 75th ($88,710) | 90th ($150,000) | 11.1% per year |
| 90th ($150,000) | 95th ($201,050) | 6.0% per year |
Bookmark this page and check back annually. Seeing your percentile climb is one of the most motivating ways to track financial progress.
What does it take to join the top 1% of income earners in the USA?
To reach the 99th percentile or top 1% of income earners in the USA, it would take an income of $430,000 to put you in the top 1% of individual income earners. The increase required is even higher if you want to reach the top 1% of household income, which would take income of $631,500.
For context, that’s roughly 8.6x the median individual income of $50,200. At this level, your income isn’t just “high” — it places you in a fundamentally different financial category where wealth accumulates rapidly, tax planning becomes complex, and your net worth likely exceeds several million dollars.
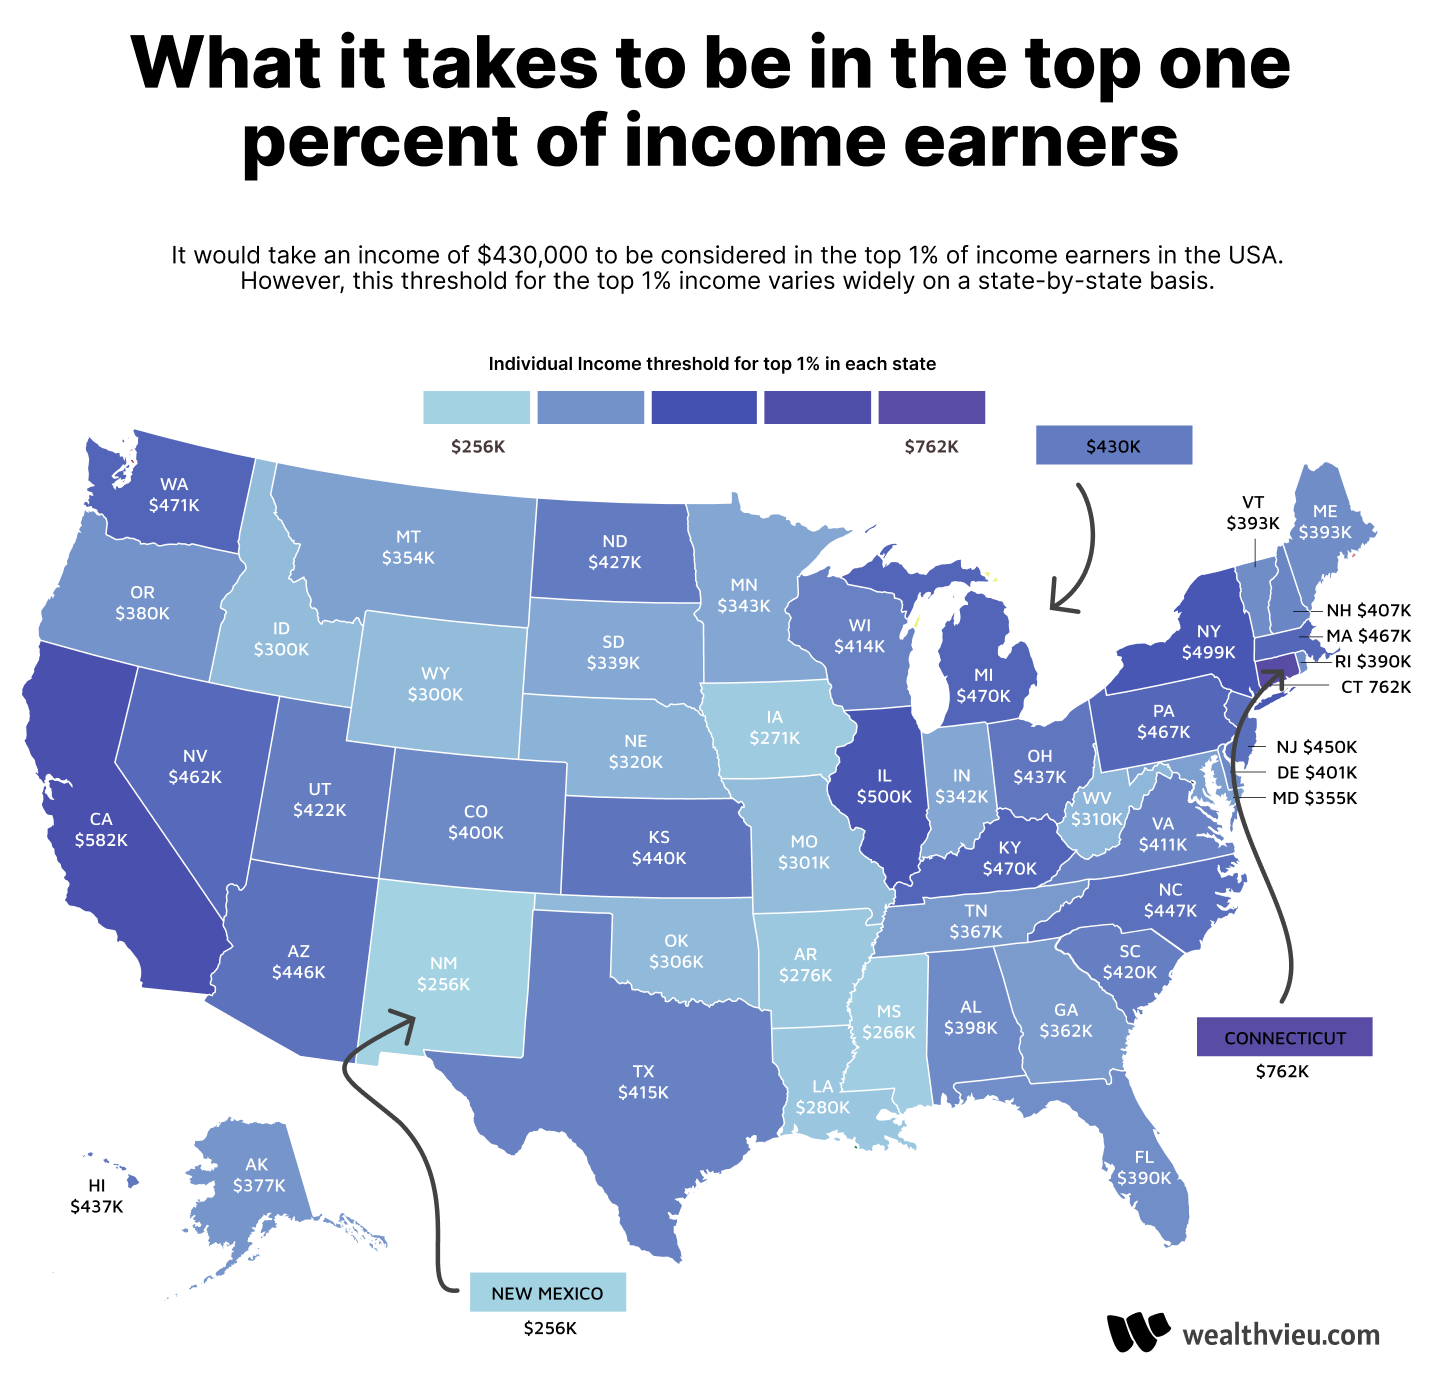
Top 1% household and individual income by state
What does it take to reach the top 1% of income earners on a state-by-state basis?
The state with the highest threshold to join the top 1% is Connecticut. It would take individual income of $761,957 or household income of $1,135,999 to join the top 1%. In contrast, Mississippi has the lowest threshold at $265,817 for individuals — nearly 3x less than Connecticut. This variation tracks closely with average salary by state and cost of living differences across the country.
This table breaks down what it would take in income to join the top 1% of income on a state-by-state basis.
Want to know what percentile you fall into? Enter your income in the calculator above to find out.
Feel free to use this visualization in your work. Please give credit by linking back to https://wealthvieu.com/income-percentile-calculator/
Interested in what it takes to be in the top 1% of wealth in the United States? Check out our net worth percentile calculator. Income and net worth don’t always align — plenty of high earners have modest net worth due to high cost of living or lifestyle spending, while steady middle-income savers can accumulate significant wealth over time.
📋 Click to expand: Top 1% Income by State (Full Table)
| State | Top 1% Household Income | Top 1% Individual Income |
|---|---|---|
| Alabama | $521,494 | $398,099 |
| Alaska | $639,115 | $376,965 |
| Arizona | $550,198 | $446,005 |
| Arkansas | $380,300 | $275,999 |
| California | $849,049 | $582,350 |
| Colorado | $528,000 | $400,150 |
| Connecticut | $1,135,999 | $761,957 |
| Delaware | $660,499 | $400,601 |
| District of Columbia | $1,033,000 | $644,410 |
| Florida | $555,002 | $389,851 |
| Georgia | $586,543 | $362,100 |
| Hawaii | $636,453 | $436,646 |
| Idaho | $485,101 | $300,401 |
| Illinois | $694,800 | $500,160 |
| Indiana | $467,510 | $341,999 |
| Iowa | $380,536 | $271,139 |
| Kansas | $852,821 | $440,300 |
| Kentucky | $773,254 | $470,005 |
| Louisiana | $399,548 | $280,038 |
| Maine | $473,999 | $392,972 |
| Maryland | $624,410 | $355,010 |
| Massachusetts | $714,795 | $467,300 |
| Michigan | $603,610 | $469,550 |
| Minnesota | $455,600 | $343,015 |
| Mississippi | $353,876 | $265,817 |
| Missouri | $465,655 | $301,100 |
| Montana | $497,502 | $354,427 |
| Nebraska | $697,302 | $320,101 |
| Nevada | $596,578 | $462,030 |
| New Hampshire | $618,613 | $407,483 |
| New Jersey | $704,678 | $450,000 |
| New Mexico | $392,031 | $256,007 |
| New York | $751,103 | $498,800 |
| North Carolina | $633,412 | $446,500 |
| North Dakota | $527,100 | $427,000 |
| Ohio | $583,259 | $437,400 |
| Oklahoma | $481,154 | $305,504 |
| Oregon | $521,203 | $380,000 |
| Pennsylvania | $603,851 | $467,491 |
| Rhode Island | $517,500 | $389,605 |
| South Carolina | $676,882 | $420,002 |
| South Dakota | $559,164 | $338,764 |
| Tennessee | $485,752 | $367,465 |
| Texas | $660,014 | $415,388 |
| Utah | $544,923 | $421,501 |
| Vermont | $587,900 | $392,500 |
| Virginia | $736,701 | $410,618 |
| Washington | $720,636 | $470,729 |
| West Virginia | $467,823 | $310,000 |
| Wisconsin | $580,850 | $413,501 |
| Wyoming | $403,024 | $300,000 |
Top 1% income percentile in the United States by age
An individual income of $430,000 is needed in 2024 to be considered in the 99th percentile or top 1% of all individual income earners in the USA.
The top 1% income is heavily influenced by age. For those who are 16 years old, it takes $85,000 a year to join the top 1% of income earners for that age. If you are 46 years old, it would take income of $920,000 to be considered in the top 1% of income earners. Peak earning years generally fall between ages 45-55, which is when the top 1% threshold is highest.
Since there are fewer observations for those earning a top 1% salary, the total income for top 1% earners as you move between age categories can vary substantially with a few individuals skewing the income.
To provide a better understanding of the threshold for the top 1% at a specific age, take into consideration the threshold in the ages above and below as well as the trend in the median income by age.
If you want to know your income percentile by age, use the income percentile by age calculator for a more personalized result.
📋 Click to expand: Top 1% Income by Age (Full Table)
| Age | Top 1% Income by Age | Median Income by Age |
|---|---|---|
| 16 | $85,000 | $8,000 |
| 17 | $85,000 | $8,500 |
| 18 | $88,000 | $13,000 |
| 19 | $108,000 | $20,000 |
| 20 | $86,406 | $25,000 |
| 21 | $100,000 | $26,400 |
| 22 | $115,000 | $30,000 |
| 23 | $119,225 | $33,000 |
| 24 | $179,998 | $37,000 |
| 25 | $200,000 | $45,000 |
| 26 | $190,000 | $46,800 |
| 27 | $200,000 | $47,000 |
| 28 | $300,000 | $50,000 |
| 29 | $270,000 | $55,000 |
| 30 | $300,000 | $55,000 |
| 31 | $300,000 | $55,000 |
| 32 | $300,000 | $58,000 |
| 33 | $278,002 | $60,000 |
| 34 | $400,000 | $60,000 |
| 35 | $400,000 | $61,500 |
| 36 | $380,000 | $60,000 |
| 37 | $380,000 | $60,000 |
| 38 | $430,000 | $60,000 |
| 39 | $500,000 | $62,500 |
| 40 | $410,000 | $60,000 |
| 41 | $410,000 | $60,000 |
| 42 | $400,000 | $62,400 |
| 43 | $400,000 | $65,000 |
| 44 | $400,000 | $61,250 |
| 45 | $400,000 | $60,000 |
| 46 | $920,000 | $65,000 |
| 47 | $500,000 | $60,000 |
| 48 | $440,000 | $65,000 |
| 49 | $500,000 | $65,000 |
| 50 | $420,000 | $70,000 |
| 51 | $450,000 | $65,000 |
| 52 | $450,000 | $65,000 |
| 53 | $430,000 | $64,000 |
| 54 | $430,000 | $65,000 |
| 55 | $350,000 | $65,000 |
| 56 | $300,000 | $60,000 |
| 57 | $530,000 | $65,000 |
| 58 | $500,000 | $60,000 |
| 59 | $370,000 | $60,000 |
| 60 | $350,000 | $60,000 |
| 61 | $500,000 | $60,000 |
| 62 | $400,000 | $65,000 |
| 63 | $350,000 | $58,000 |
| 64 | $550,000 | $60,000 |
| 65 | $450,000 | $55,000 |
| 66 | $400,000 | $55,735 |
| 67 | $360,000 | $50,000 |
| 68 | $750,000 | $50,000 |
| 69 | $600,000 | $43,664 |
| 70 | $550,000 | $44,000 |
Top 2% income percentile in USA
To be in the top 2% of individual income earners in the US, you need to earn at least $280,000 per year in 2024. The top 2% threshold varies significantly by state. In high-cost states like Connecticut and California, the top 2% household income can exceed $500,000, while in states like Mississippi and Arkansas it may be closer to $250,000.
The gap between the top 1% ($430,000) and top 2% ($280,000) is $150,000, which illustrates how rapidly income concentrates at the very top of the distribution. Careers at this level typically include senior directors, specialized physicians, law firm partners, and successful small business owners. Most top 2% earners are between ages 40-60.
Top 5 percent income in USA
To be considered in the top 5% of income earners or 95th percentile, the threshold is $201,050 in 2024. This means that approximately 8.3 million Americans earn above this level. The top 5% is often considered the entry point to “high income” status and is a common benchmark used by financial planners and economists.
To put this in perspective, the gap between the median income ($50,200) and the top 5% threshold ($201,050) is roughly 4x. However, the gap between the top 5% and top 1% ($430,000) is more than 2x, showing how income accelerates at higher percentiles. At $201,050 you’re earning enough to comfortably max out retirement accounts, build significant savings, and still maintain a solid lifestyle in most American cities.
Top 5% earners who invest consistently can expect to reach top 10% net worth territory within a decade, assuming they avoid the lifestyle inflation trap that catches many high earners.
Top 10 percent income in the USA
To reach a top 10% individual income or the 90th percentile of individual income earners in the USA, you would need to earn $150,000 in 2024. Is $150k a good salary? — it places you ahead of 9 out of 10 Americans.
At this level, your take-home pay after federal and state taxes varies enormously by location. A $150,000 salary in Texas (no state income tax) nets roughly $10,000-12,000 more per year than the same salary in California or New York. Combined with cost of living differences, the same percentile ranking can represent vastly different lifestyles.
Careers at the 90th percentile include experienced software engineers, senior nurses with specializations, pharmacists, mid-level managers in large corporations, and skilled tradespeople who own their own businesses.
🧮 Related Calculators You Might Find Useful
Now that you know your income percentile, explore these related tools:
Wealth & Net Worth
- Net Worth Percentile Calculator — Income is only part of the picture. See how your total wealth compares to other Americans.
- Net Worth Percentile by Age — Compare your net worth to others in your age group.
- How Much Should I Have Saved by Age? — Savings benchmarks for every decade of life.
- Compound Interest Calculator — See how your savings could grow over time.
Income & Career
- Income Percentile by Age — Compare your income to others your age, not all Americans.
- Hourly to Salary Calculator — Convert your hourly rate to an annual salary.
- Average Income by Occupation — See what different careers actually pay.
- Average Salary by State — How salaries vary across the country.
Tax Planning
- Federal Tax Brackets — Understand your marginal vs effective tax rate.
- Tax Bracket Calculator — See exactly how your income is taxed.
- Self-Employment Tax Guide — Tax obligations for freelancers and business owners.
Housing & Cost of Living
- Mortgage Affordability Calculator — What home price can your income support?
- Cost of Living Calculator by City — Compare your purchasing power across cities.
❓ Frequently Asked Questions
How is income percentile calculated? Income percentile is calculated by comparing your income to all other earners in the U.S. If you’re in the 75th percentile, you earn more than 75% of individuals and less than 25%. The data comes from the Census Bureau’s Current Population Survey, the same source used for the official median income figures.
Is this before or after taxes? This calculator uses pre-tax (gross) income. Your after-tax income would place you in a different position since taxes vary by state and filing status. See our federal income tax brackets to understand how much you keep.
Should I use individual or household income? Use individual income to compare your personal earnings to other workers. Use household income to compare your family’s total earnings to other families — useful for budgeting, housing decisions, and understanding median household income benchmarks.
Why do income percentiles matter? Understanding your percentile helps with:
- Salary negotiations (know your market value based on average pay for your role)
- Financial planning (realistic saving goals tied to what you should have saved)
- Career decisions (which paths lead to higher brackets — see income by education)
- Geographic decisions (where your income goes furthest based on cost of living)
How often is this data updated? This calculator uses 2024 Census data (IPUMS CPS). We update the data annually when new Census figures are released.
Explore More US Income Data
- Income Percentile by Age Calculator — see how your income ranks within your age group
- Income Percentile by State — find your percentile for your specific state
- Top 1% Income Threshold — how much you need to earn to reach the top
- Average Income by Age — median and mean income at every age bracket
- Middle Class Income Range 2026 — where the middle class begins and ends
- Net Worth Percentile Calculator — see how your total wealth compares
Compare Income Percentiles by Country
Wealthvieu covers income percentile calculators for every major English-speaking country. See how salaries compare globally:
- UK Income Percentile Calculator
- Australia Income Percentile Calculator
- Ireland Income Percentile Calculator
- New Zealand Income Percentile Calculator
- Singapore Income Percentile Calculator
📚 Data Source
2024 income percentile source: Sarah Flood, Miriam King, Renae Rodgers, Steven Ruggles, J. Robert Warren, Daniel Backman, Annie Chen, Grace Cooper, Stephanie Richards, Megan Schouweiler, and Michael Westberry. IPUMS CPS: Version 11.0 [dataset]. Minneapolis, MN: IPUMS, 2023. https://doi.org/10.18128/D030.V11.0
The content on Wealthvieu is for informational purposes only and should not be considered financial, tax, or investment advice. Consult a qualified professional before making financial decisions. Full disclaimer · Editorial policy