Use this net worth percentile calculator to see where your net worth ranks in the U.S. Enter your assets and liabilities to estimate your percentile and compare with national wealth benchmarks.
Last updated: April 17, 2026.
Looking for benchmarks and strategy in one place? Start with the complete U.S. net worth guide.
The data in this calculator is from the Federal Reserve Survey of Consumer Finances (SCF) for the year 2023, which is the most recent data available. The SCF is conducted every three years, so new data for net worth percentiles will be released in 2026.
Net worth is calculated as total assets minus total liabilities. Assets include everything you own that has value — home equity, retirement accounts (401k, IRA), brokerage accounts, savings, vehicles, and other property. Liabilities include all debts: mortgages, student loans, credit card balances, auto loans, and any other money you owe. The resulting number is your net worth, and it’s the most comprehensive single measure of financial health.
If you want to see how your individual income percentile compares to others in the U.S. you can use our income percentile calculator. For a breakdown by age, see our net worth percentile by age calculator.
Household net worth in the United States
The median household net worth in the US was $192,084 in 2023. The average net worth in 2023 was $1,059,470 — more than five times the median. This enormous gap between the average and median is the clearest illustration of wealth concentration in America: a relatively small number of extremely wealthy households pull the average dramatically upward, while the median (the midpoint where half of households are above and half below) tells a more grounded story.
For context, a net worth of $192,084 might consist of $120,000 in home equity, $50,000 in retirement accounts, a $15,000 car, and $7,000 in savings. That’s a financially stable household, but far from wealthy by most people’s definition. The average of $1,059,470 is distorted by the roughly 20 million households with net worth above $1 million and the much smaller group (about 1.4 million households) above $10 million.
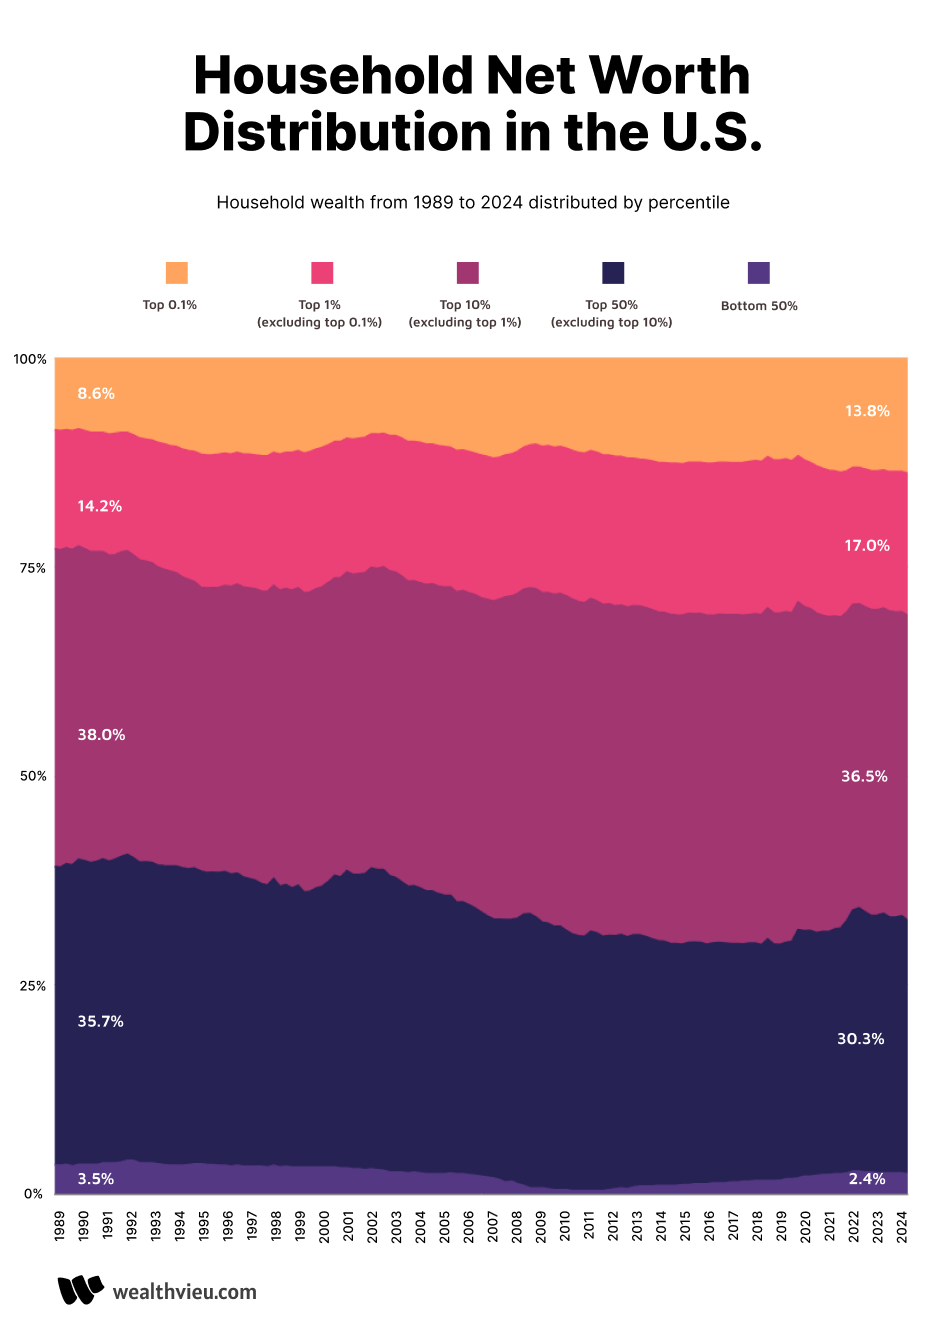
Household net worth distribution in the U.S.
This chart shows the distribution of wealth in the US by percentile. The top 0.1% of households hold 13.80% of the wealth in the United States. The top 1.0% of households in the U.S. account for 30.80% of all the wealth in the United States as of 2024.
Top 1% household net worth in the US
To be considered in the 99th percentile or top 1% of household net worth in the US you need at least $13,666,778 in 2023. This is a staggering threshold that illustrates just how concentrated wealth is at the top. At this level, net worth is almost entirely driven by investment portfolios, business ownership, and real estate holdings rather than savings from employment income. Many top-1% households derive more annual income from capital gains and dividends than from salary.
Top 10% household net worth
The 90th percentile or to be considered in the top 10% of households for net worth the threshold is $1,920,758. While this is a substantial amount, it’s achievable for dual-income professional households who started saving and investing in their 20s or 30s. A couple who maxed out their 401(k) contributions for 25 years while owning a home in an appreciating market could realistically reach this level by their mid-50s to early 60s without any inheritance or extraordinary income.
Individual net worth by age in the United States
The net worth of an individual is highly correlated to age, which is why comparing your net worth against your own age group gives a much more meaningful picture than comparing against the national median. A 25-year-old with $50,000 in net worth is doing exceptionally well relative to peers, but that same number would be below the median for someone in their 40s.
For example, the median net worth of an individual between the ages of 18-24 is $10,222, which is the lowest of all age brackets for many reasons including this age bracket includes students with debt and individuals fresh to the workforce. Compare this to an age bracket of 35-39 which has a median net worth of $138,588.
Average and median net worth by age (2023)
The table below shows both average and median net worth by age group for 2023. Use median as your personal benchmark — it represents the midpoint American at each age. The Avg/Median ratio column shows how much high-net-worth outliers inflate the average: a ratio of 4x or above means a relatively small number of very wealthy people in that bracket are pulling the average well above the typical experience. The gap between average and median grows sharply through mid-career, peaking in the 75–79 bracket where the average is nearly 5x the median.
| Age Group | Median Net Worth | Average Net Worth | Avg/Median |
|---|---|---|---|
| 18–24 | $10,222 | $112,104 | 11.0x |
| 25–29 | $31,470 | $120,183 | 3.8x |
| 30–34 | $88,631 | $258,075 | 2.9x |
| 35–39 | $138,588 | $501,295 | 3.6x |
| 40–44 | $134,382 | $590,710 | 4.4x |
| 45–49 | $213,586 | $781,936 | 3.7x |
| 50–54 | $266,140 | $1,132,497 | 4.3x |
| 55–59 | $321,074 | $1,441,987 | 4.5x |
| 60–64 | $392,860 | $1,675,294 | 4.3x |
| 65–69 | $393,480 | $1,836,884 | 4.7x |
| 70–74 | $438,700 | $1,714,085 | 3.9x |
| 75–79 | $338,180 | $1,629,275 | 4.8x |
| 80+ | $327,200 | $1,611,984 | 4.9x |
The sharpest jump in median net worth occurs between 25–29 and 30–34 — the decade when homeownership typically begins and home equity becomes the largest component of net worth for most Americans. The 40–44 median ($134,382) is actually slightly lower than the 35–39 median ($138,588), reflecting how divorce, medical costs, and mid-career disruptions can erode wealth during peak earning years for a meaningful share of households.
Source: Federal Reserve Survey of Consumer Finances (SCF) 2023.
Net worth percentile by age
Net worth varies dramatically by age as wealth accumulates over a lifetime of earning, saving, and investing. Younger age groups typically have lower net worth due to student debt, lower incomes, and less time for investments to compound. Peak net worth is typically reached between ages 65 and 74 as retirement savings, home equity, and investment portfolios reach their highest values.
For a detailed breakdown of net worth percentiles across all age groups, use our net worth percentile by age calculator which provides data for the 25th, 50th, 75th, 90th, and 99th percentiles for each age bracket.
Source: Federal Reserve Survey of Consumer Finances (SCF) 2023
Net Worth by Income Level
Wealth accumulation correlates strongly with income, but income alone doesn’t determine net worth. High-income households with poor savings habits often have lower net worth than moderate-income households with disciplined saving and investing over decades.
Median Net Worth by Income Percentile (2023)
| Income Percentile | Income Range | Median Net Worth | Ratio (NW/Income) |
|---|---|---|---|
| Bottom 20% | Under $25,000 | $7,800 | 0.3x |
| 20-40th % | $25,000-$48,000 | $37,600 | 1.0x |
| 40-60th % | $48,000-$85,000 | $126,000 | 2.0x |
| 60-80th % | $85,000-$145,000 | $242,900 | 2.3x |
| 80-90th % | $145,000-$225,000 | $492,100 | 2.7x |
| 90th %+ | Over $225,000 | $1,920,758 | 6.5x |
Source: Federal Reserve Survey of Consumer Finances, 2023.
The Savings Rate Rule
Saving rate is one of the most controllable factors in building net worth. In general, households that save a higher share of income and invest consistently may build wealth faster over time than households that save less, but stock market returns are not guaranteed and results depend on time horizon, contributions, fees, taxes, and market performance. For example, investing $500 per month for 30 years at a 7% average annual return would accumulate about $567,000 before taxes and fees.
The Federal Reserve SCF data consistently shows that households with similar incomes can have net worth varying by 10x or more — almost entirely explained by savings rate and investment discipline rather than income level.
Net Worth to Income Ratio (“Your Number”)
Financial planners often use a simple rule of thumb: your net worth should roughly equal your age × income ÷ 10. A 40-year-old earning $100,000 targets $400,000. This is aspirational — most Americans fall below it — but it provides a useful directional benchmark.
How to Build Net Worth
Net worth grows by increasing assets, reducing liabilities, or both. These are the most impactful strategies at each income level:
The Five Net Worth Levers
| Lever | What It Means | Top Actions |
|---|---|---|
| Earn more | Higher income = more to save | Skills development, job switching, side income |
| Spend less | Saving rate is the #1 driver of early wealth | Budget, cut housing/cars costs |
| Save systematically | Automate savings before you can spend | 401(k) auto-contribution, automatic transfers |
| Invest effectively | Compound growth on savings | Low-cost index funds, tax-advantaged accounts |
| Manage debt | High-interest debt destroys net worth | Pay off credit cards, refinance high-rate debt |
Net Worth by Decade: What’s “On Track”
| Age | 25th Percentile | Median | 75th Percentile | “On Track” Goal* |
|---|---|---|---|---|
| 25 | -$5,000 | $10,222 | $35,000 | $25,000 |
| 30 | $6,000 | $31,470 | $90,000 | $75,000 |
| 35 | $15,000 | $88,631 | $215,000 | $150,000 |
| 40 | $35,000 | $134,382 | $400,000 | $275,000 |
| 45 | $60,000 | $213,586 | $600,000 | $450,000 |
| 50 | $90,000 | $266,140 | $800,000 | $650,000 |
| 55 | $130,000 | $321,074 | $1,000,000 | $900,000 |
*“On Track” goal assumes 1x income at 30, increasing to 10x income by retirement.
Sources
- Board of Governors of the Federal Reserve System. “Survey of Consumer Finances (SCF).” federalreserve.gov/econres/scfindex.htm
The content on Wealthvieu is for informational purposes only and should not be considered financial, tax, or investment advice. Consult a qualified professional before making financial decisions. Full disclaimer · Editorial policy