The median household income in the United States was $74,755 in 2022 which adjusted for inflation would be $79,916 in 2024. The average household income in the United States for the same period is $105,555 which is $112,842 in 2024 adjusting for inflation. We have broken down United States household income distributions by states to help visualize household income.
Median vs. average household income
The median household income is different from the average because the median represents the middle point — half of households earn more and half earn less. The average household income is higher at $105,555 because it is pulled up by extremely high earners. For example, the top 1% of income earners make at least $430,000, which significantly skews the average upward. The median is generally considered a better measure of what a typical household earns.
For a comparison of individual income rather than household income, see the median personal income by state or average personal income by state.
Median household income by state
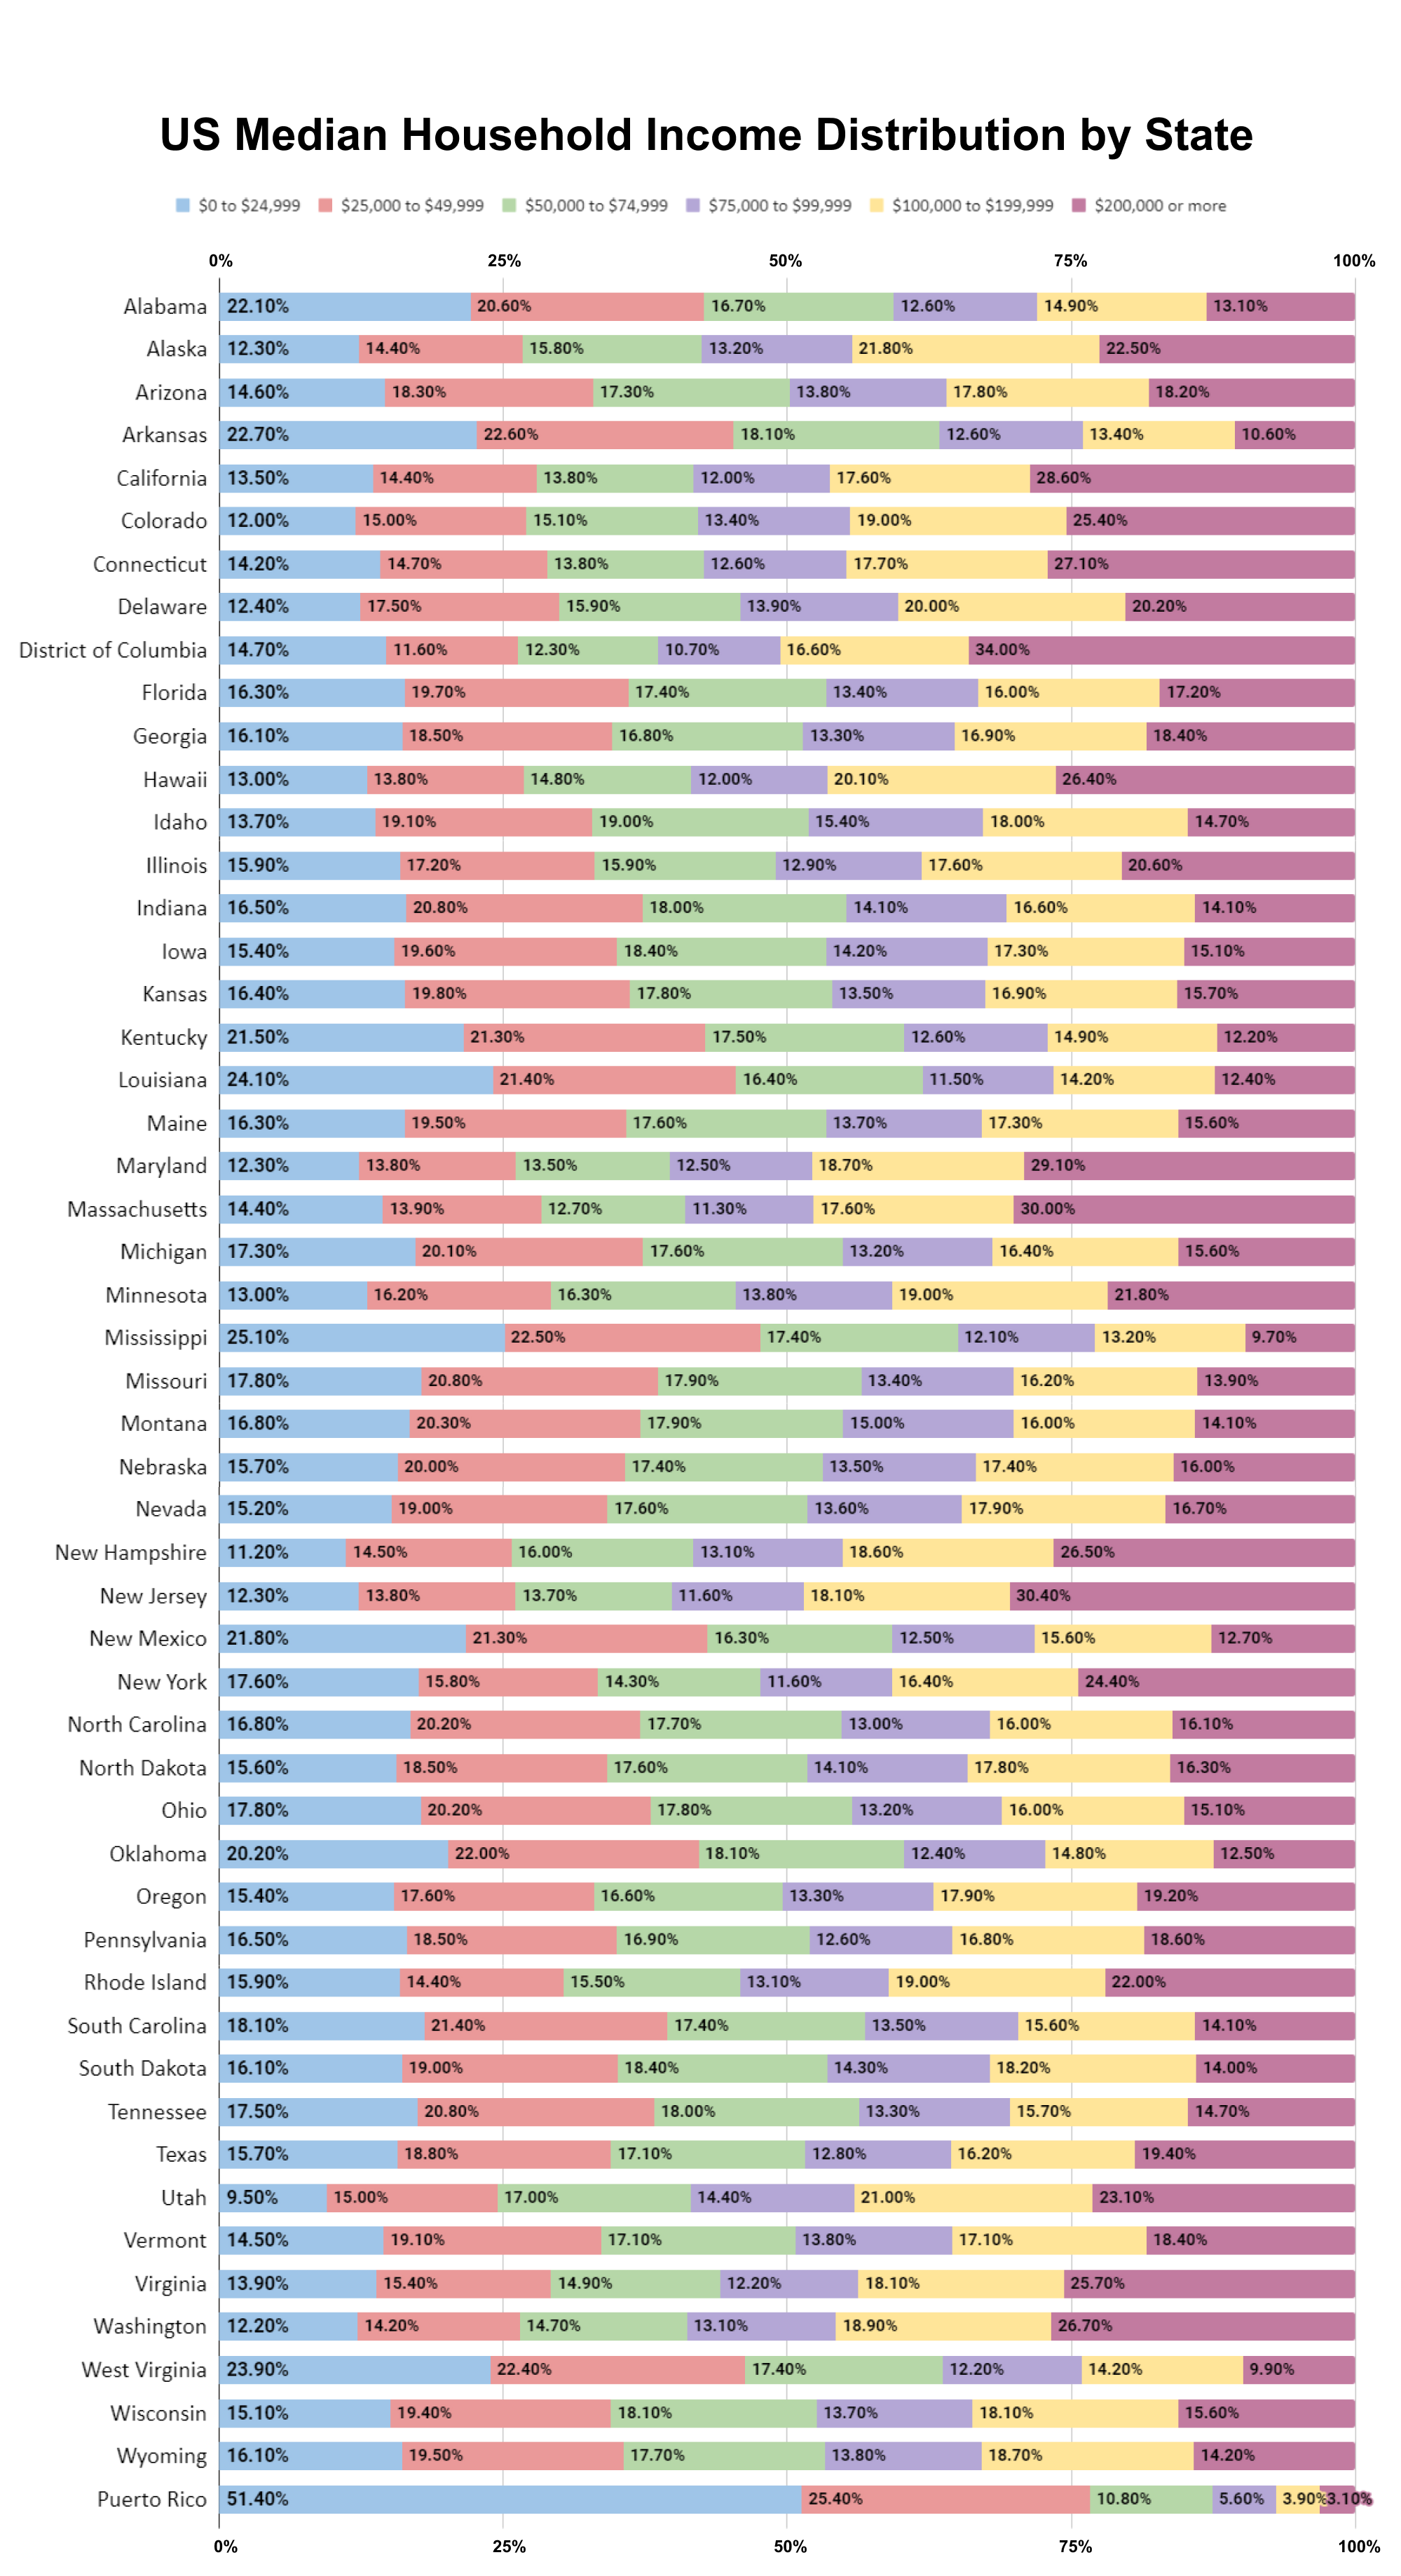
Here is the median and average household income of each state in 2022 inflation adjusted dollars. The District of Columbia has the highest median household income of $101,027 and highest average household income of $148,872 of any state. The state with the lowest median income is Puerto Rico with $24,112 they also have the lowest average household income of $39,142.
| State | Median Income (Dollars) | Average Income (Dollars) |
|---|---|---|
| Alabama | $59,674 | $82,956 |
| Alaska | $88,121 | $109,524 |
| Arizona | $74,568 | $101,316 |
| Arkansas | $55,432 | $76,853 |
| California | $91,551 | $131,504 |
| Colorado | $89,302 | $119,039 |
| Connecticut | $88,429 | $128,160 |
| Delaware | $82,174 | $105,438 |
| District of Columbia | $101,027 | $148,872 |
| Florida | $69,303 | $99,349 |
| Georgia | $72,837 | $99,863 |
| Hawaii | $92,458 | $120,969 |
| Idaho | $72,785 | $94,503 |
| Illinois | $76,708 | $106,728 |
| Indiana | $66,785 | $88,805 |
| Iowa | $69,588 | $92,695 |
| Kansas | $68,925 | $93,221 |
| Kentucky | $59,341 | $82,614 |
| Louisiana | $55,416 | $79,175 |
| Maine | $69,543 | $93,555 |
| Maryland | $94,991 | $125,876 |
| Massachusetts | $94,488 | $133,823 |
| Michigan | $66,986 | $91,856 |
| Minnesota | $82,338 | $109,737 |
| Mississippi | $52,719 | $72,624 |
| Missouri | $64,811 | $88,586 |
| Montana | $67,631 | $90,874 |
| Nebraska | $69,597 | $94,599 |
| Nevada | $72,333 | $98,422 |
| New Hampshire | $89,992 | $119,452 |
| New Jersey | $96,346 | $134,191 |
| New Mexico | $59,726 | $82,382 |
| New York | $79,557 | $119,130 |
| North Carolina | $67,481 | $94,353 |
| North Dakota | $71,970 | $97,699 |
| Ohio | $65,720 | $90,109 |
| Oklahoma | $59,673 | $82,741 |
| Oregon | $75,657 | $102,923 |
| Pennsylvania | $71,798 | $100,015 |
| Rhode Island | $81,854 | $108,023 |
| South Carolina | $64,115 | $88,704 |
| South Dakota | $69,728 | $90,806 |
| Tennessee | $65,254 | $89,799 |
| Texas | $72,284 | $101,738 |
| Utah | $89,168 | $114,044 |
| Vermont | $73,991 | $97,261 |
| Virginia | $85,873 | $119,058 |
| Washington | $91,306 | $125,847 |
| West Virginia | $54,329 | $75,265 |
| Wisconsin | $70,996 | $94,085 |
| Wyoming | $70,042 | $90,018 |
| Puerto Rico | $24,112 | $39,142 |
Source: United States Census Bureau
How does household income impact home affordability?
Household income is one of the most important factors in determining how much home you can afford. With the median home price at $419,200 and the median household income at approximately $79,916, the mortgage affordability gap continues to grow in many states. The general rule is that your housing costs should not exceed 30% of your gross income.
To find out where your income falls among all households in the US, try our income percentile calculator. You can also see how much income is needed to afford a home in each state, or use a mortgage affordability calculator to estimate how much house you can afford based on your household income.
See also: Historical Home Cost to Income Ratio | Minimum Wage by State
Sources
- U.S. Census Bureau. “Income and Poverty in the United States.” census.gov/topics/income-poverty
- U.S. Department of Labor. “Wages and the Fair Labor Standards Act.” dol.gov/agencies/whd/flsa
- Social Security Administration. “Benefits and Eligibility Information.” ssa.gov/benefits

The content on Wealthvieu is for informational purposes only and should not be considered financial, tax, or investment advice. Consult a qualified professional before making financial decisions. Full disclaimer · Editorial policy